Boost your trading skills with Solidifin Finance insights
Access essential tips and data-driven insights to make informed trading decisions
Using analytics effectively
Leverage Solidifin Finance analytical tools to enhance your trading strategy. With the right approach, you can gain a competitive edge by interpreting real-time data accurately.
- Set alerts for key events: Use alert tools to monitor economic announcements and price changes, allowing you to react swiftly to market moves.
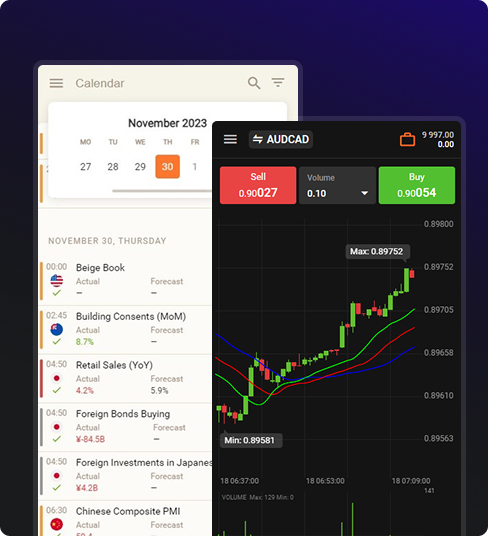
- Track key indicators: Focus on indicators like moving averages, RSI, and MACD to identify trends and optimal entry and exit points.
- Analyze historical data: Reviewing past market patterns can help you anticipate future price movements based on similar conditions.
- Combine indicators for confirmation: Use a mix of indicators to validate signals and avoid relying on a single source for decisions.
- Monitor volume for confirmation: Volume data can validate price moves; high volume typically strengthens a trend, while low volume may indicate weakness.
Understanding trading hours
Knowing when different markets open and close is crucial for maximizing opportunities. Some hours are more active and offer greater potential for gains.
- Overlapping sessions: Liquidity is highest during overlapping trading sessions, like the London-New York overlap, providing ideal trading conditions.
- Best hours for Forex: The London session (8 AM to 4 PM GMT) is usually the most active, which can provide better trading opportunities due to high volume.
- Avoid off-peak hours: Lower liquidity during off-peak hours, like late New York session, may lead to erratic price movements.
- Be aware of economic calendar events: Major announcements during market hours can increase volatility, so align your trading times accordingly.
- Transition periods: Market session changes, such as from Asia to Europe, often result in lower liquidity, so watch for potential spikes during these times.
Reading market sentiment
Market sentiment can drive prices significantly, so learning to interpret it will help you stay aligned with trends or spot potential reversals
Monitor news and social sentiment
News events and social media mentions can reveal shifts in interest, so track these for early signals
of potential price movements
Analyze volume and open interest
High volume often confirms a strong trend, while low volume may indicate that a trend is weakening or
reversing
Use sentiment indicators
Sentiment indicators, such as the Fear and Greed index, show trader sentiment, helping to gauge market
mood
Follow correlated markets
Watch other correlated assets (like gold and the USD) for signs of sentiment shifts in related markets
Watch for divergence
If market sentiment doesn’t align with price movements, it may indicate a potential reversal or
correction